on
Air War
Intro
In 2022 alone, over $6.4 billion has been spent on election ads, and AdImpact estimates this number will climb to $9.6 billion by the end of the 2022 cycle (CNBC). Campaign advertising has evolved from radio to tv and now to social media, making it hard to track in aggregates and particularly hard to causally identify its impact. Many political scientists have researched this relationship; specifically, Gerber et al. use a “spillover design” to test whether television ads persuade viewers in uncontested states. They find a statistically significant relationship via persuasion, but less so regarding mobilization (Gerber). Following this interesting result, I will use this blog post to explore whether campaign ads have effects at the district level in US house races between 2006-2018.
I chose to keep the predictive model for 2018 because then I could properly test how they’d done and I wasn’t confident that the ad data would transfer over well to 2022. Hence, I use my the data pre-2018 as my training dataset, holding out the 2018 data for my model validation.
Data
My primary focus this week was reformatting my data to be in a longer format, such that each row represented a candidate for each cycle’s race. I began by reformatting the incumbency data and then joined that to data from state economic variables, generic ballots, and advertising information from the Wesleyan Media Project.
The advertising data refers to all the tv ads during a candidate’s cycle. I did not include radio and social media ads due to constraints, but that would be very worthwhile too.
EDA
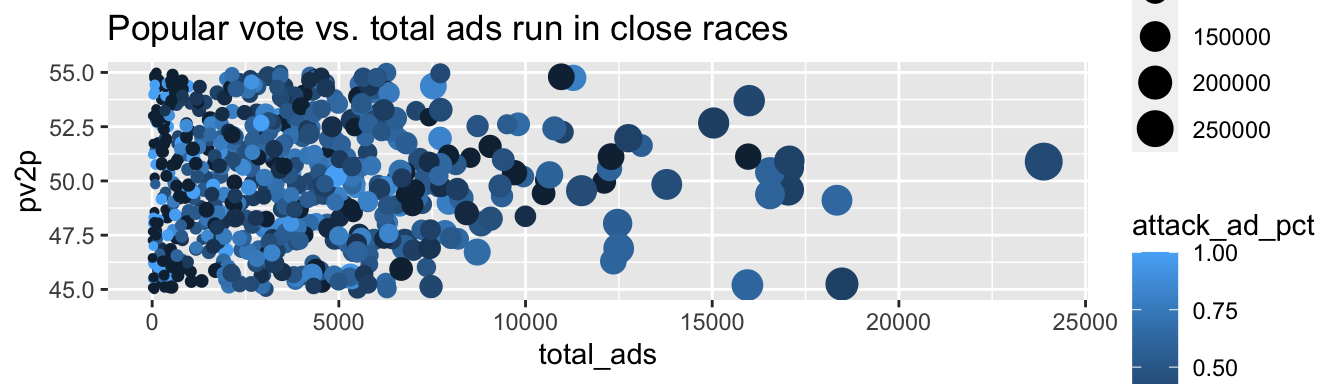
To visualize the ad data, I perform a few exploratory plots. I begin with a visual of ad data, looking at ad data (total ads run and unique stations aired) over time. In my first plot, I look at the popular vote for a candidate versus their total ads, given that the candidate has at least 1 ad. In the second plot, I examine the same relationship for close races (margin of 10 percentage points). I also have it color coded for the percentage of the ads that were tagged “attack,” where the candidate was attacking their competitor
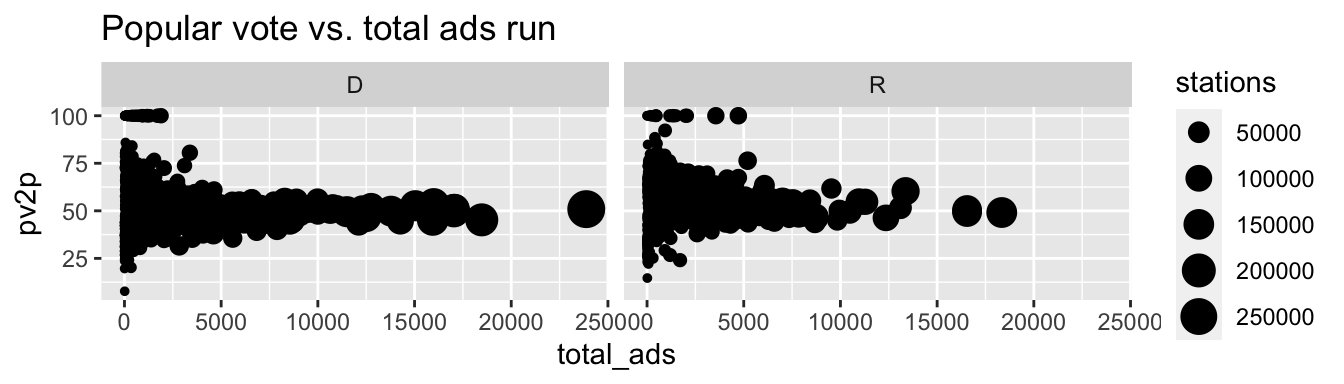
I find it interesting that Democrats were on average overspending on ads in races that they lost by large margins while Republicans were more likely to overspend on ads in races that they ended up winning. The points where the vote went 100 or 0% represented uncontested races, so I’m assuming their opponents dropped out at the end.
Model
In building my models, I regress a binary of whether or not the candidate won their district a series of independent variables. I limited the dataset to prior to 2018, choosing to use the 2018 cycle as my “testing data.” I choose to use logistic regression to properly model this outcome. In my first model, I only use fundamental data, which includes: the party of the candidate, the party’s previous voteshare in that district, the state’s unemployment rate, the party’s generic ballot voting (centered at 44), whether the candidate is in the same party as the sitting president interacted by a factored variable for whether it’s a midterm year, and the amount of terms of the candidate (0 if challenger). In my next two models, I incorporate ad data. For the second regression, I only ad in a term for the total ads run by the candidate during that cylce. In the third regression, I also include a term for the total stations the ad aired on and the percentage of ads deemed “attack.”
##
## ====================================================================
##                                     Dependent variable:
##                        ---------------------------------------------
##                                         party_wins
##                        Fundamentals + Number of Ads + ad information
##                            (1)            (2)             (3)
## --------------------------------------------------------------------
## prev                     0.116***      0.116***         0.115***
##                          (0.006)        (0.006)         (0.006)
##
## Unemployed_prct           -0.001        -0.003           -0.004
##                          (0.034)        (0.034)         (0.034)
##
## approval_cent             0.0003        -0.004           -0.003
##                          (0.041)        (0.041)         (0.041)
##
## partyR                  -0.593***      -0.575***       -0.586***
##                          (0.192)        (0.192)         (0.192)
##
## same_party                0.141          0.140           0.140
##                          (0.244)        (0.244)         (0.245)
##
## MidtermYear              1.940***      1.905***         1.904***
##                          (0.207)        (0.208)         (0.210)
##
## term                     0.817***      0.815***         0.817***
##                          (0.046)        (0.046)         (0.046)
##
## total_ads                              0.0001**         0.0002**
##                                        (0.00003)        (0.0001)
##
## stations                                               -0.00002**
##                                                        (0.00001)
##
## attack_ad_pct                                            -0.003
##                                                         (0.274)
##
## same_party:MidtermYear  -4.464***      -4.491***       -4.477***
##                          (0.360)        (0.361)         (0.361)
##
## Constant                -6.794***      -6.824***       -6.809***
##                          (0.385)        (0.386)         (0.386)
##
## --------------------------------------------------------------------
## Observations              3,706          3,706           3,706
## Log Likelihood           -822.867      -820.430         -818.397
## Akaike Inf. Crit.       1,663.735      1,660.860       1,660.794
## ====================================================================
## Note:                                    *p<0.1; **p<0.05; ***p<0.01
As the second and third regression outputs demonstrate, the number of ads has a small positive correlation with ods of getting elected. The more important variables appear to be the fundamentals, including: the voteshare in the district the year prior, whether it’s a midterm year, whether the candidate represents the same party as the president, and the number of terms of the candidate. Unintuitively, there is a negative correlation for the stations aired on, but the coefficient is so small that it does not seem meaningful.
Validation
To check how well my models performed, I performed 3 main validation measures: 2) Built a classification function to determine the area under curve, sensitivity, and specificity measures for model on testing dataset. 1) Plotting the actual results against my predictions on the Training dataset (2006-2016). 3) Plotted the actual results against my predictions on the testing dataset (2018)
##             Fundamental Model + Ad NUmber + Ad Info
## auc         0.9130332         0.915286    0.9133729
## sensitivity 79.74684          81.77215    81.51899
## specificity 90.12658          88.35443    90.12658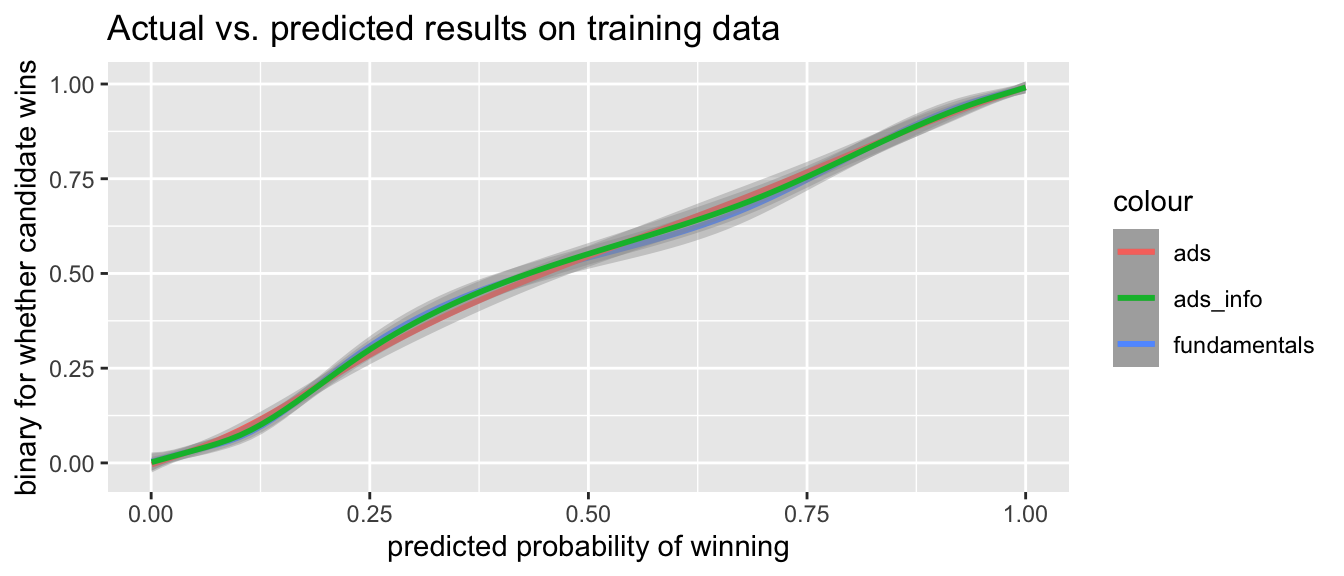
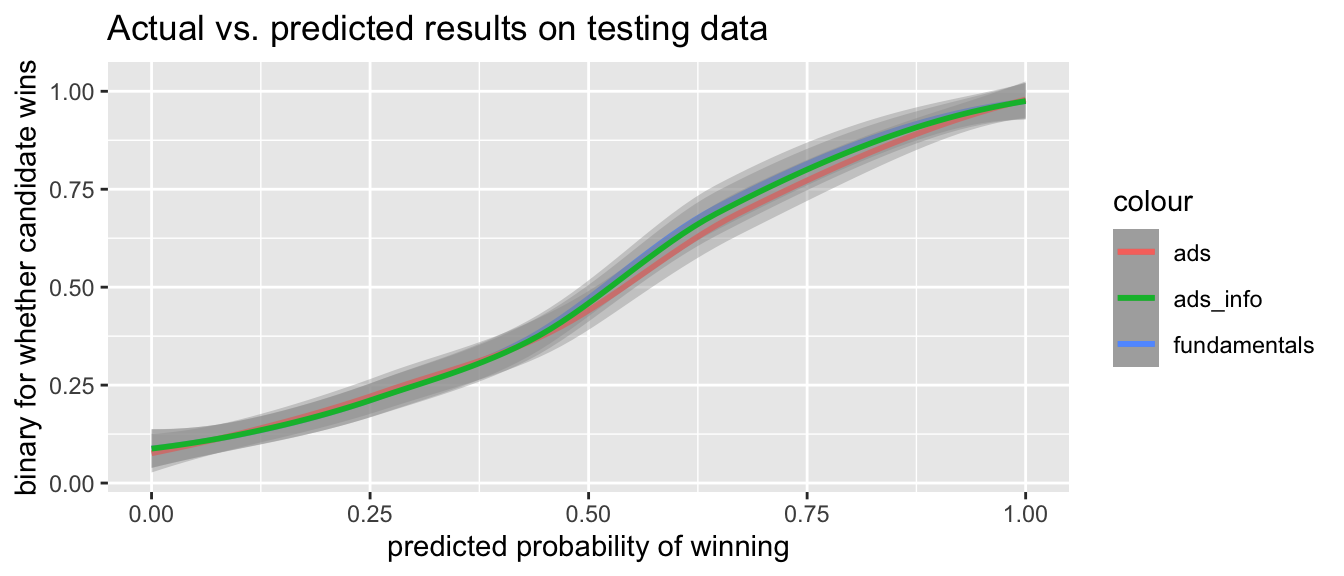
As the two graphs show, the models perform very similarly to eachother on both the testing and training datasets. Moreover, my classification table reports very similar results with auc, sensitivity (false positives), and specificity (false negatives). Therefore, I don’t have significant evidence that the ad variables added improvement to my models, but that may be due to my limitations. I grouped ad data by district, hence not capturing all the nuances of the dates they were aired. Similarly, there were many candidates who didn’t have ad data and the dataset was missing 2008 data.
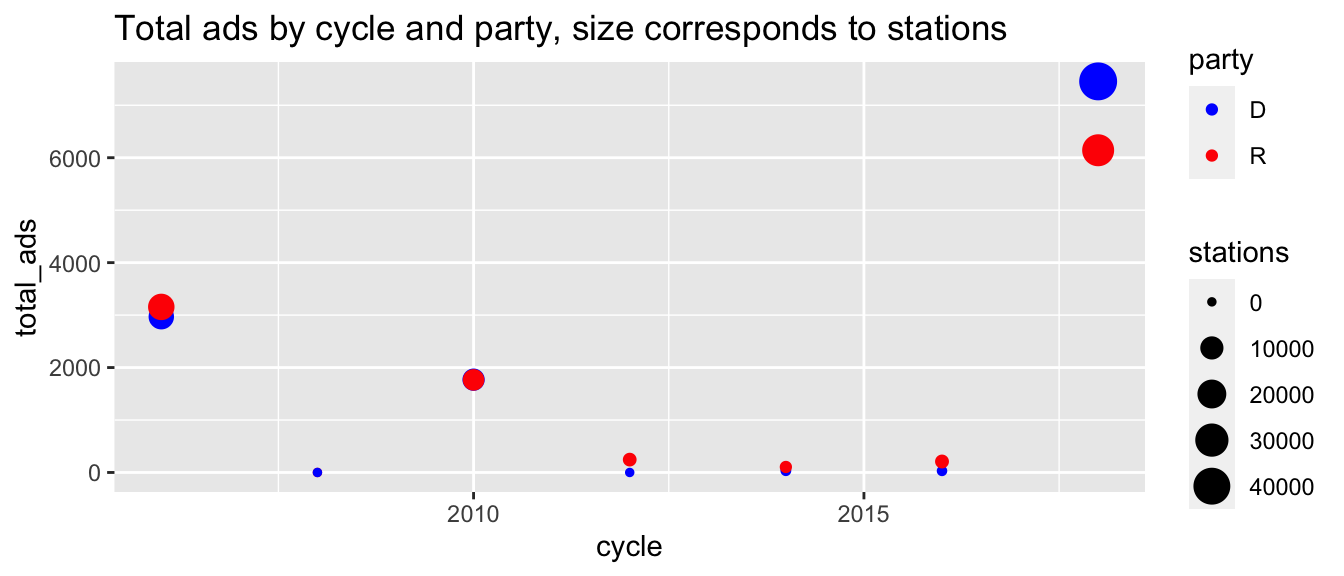
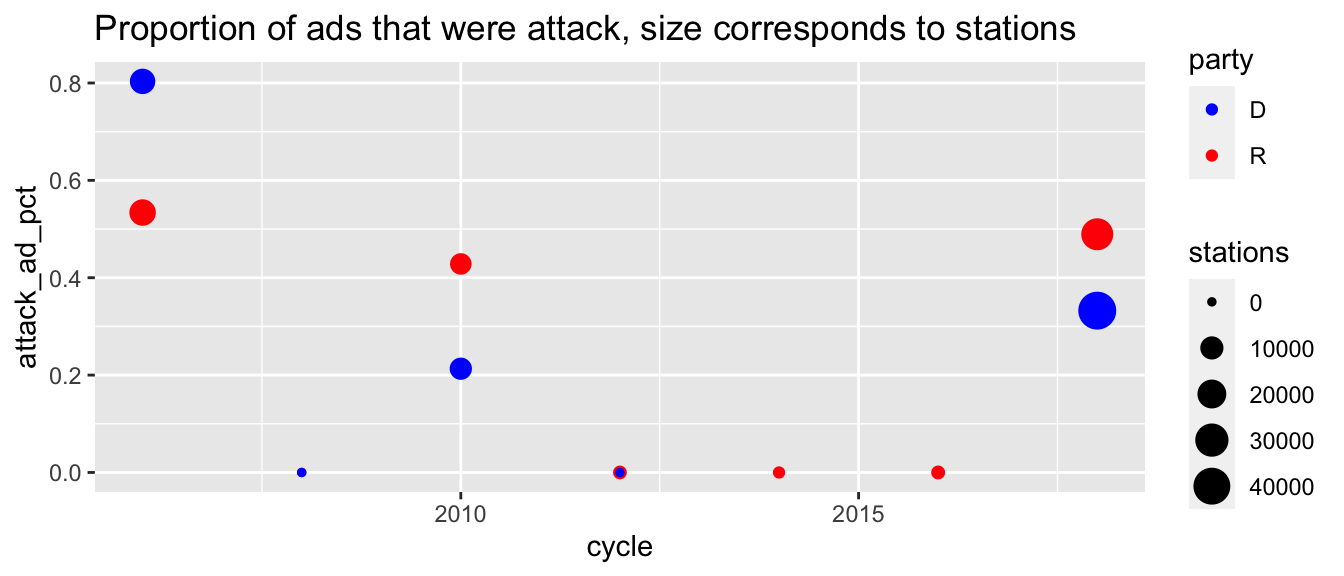
Ohio 01 Section
To end, I look at ad data in my district, Ohio 01. While there is not large amounts of data, these graphs show that Democrats and Republicans have been about equal in total ads and stations aired. However, Republicans have consistently used more attack ads.
Conclusion
Moving forward, I don’t plan to use ads data because there isn’t a comprehensive database for 2022 candidates. However, I think this exploration provided really interesting insight, beginning to suggest that advertising has a positive significant impact on a candidate’s odds of getting elected. Next week, I am hoping to incorporate presidential approval data because I think that may be more useful than the generic ballot, which did not appear significant in my regressions. Additionally, I will work on drawing accurate logistic interpretations, since the exact translation can be tricky being calculated in terms of log odds. Finally, I will bind the 2022 data to my cleaned long dataset so I can start making the predictions for 2022.
Citations
Alan S Gerber, James G Gimpel, Donald P Green, and Daron R Shaw. How Large and Long- lasting are the Persuasive Effects of Televised Campaign Ads? Results from a Randomized Field Experiment. American Political Science Review, 105(01):135–150, 2011.
Extra
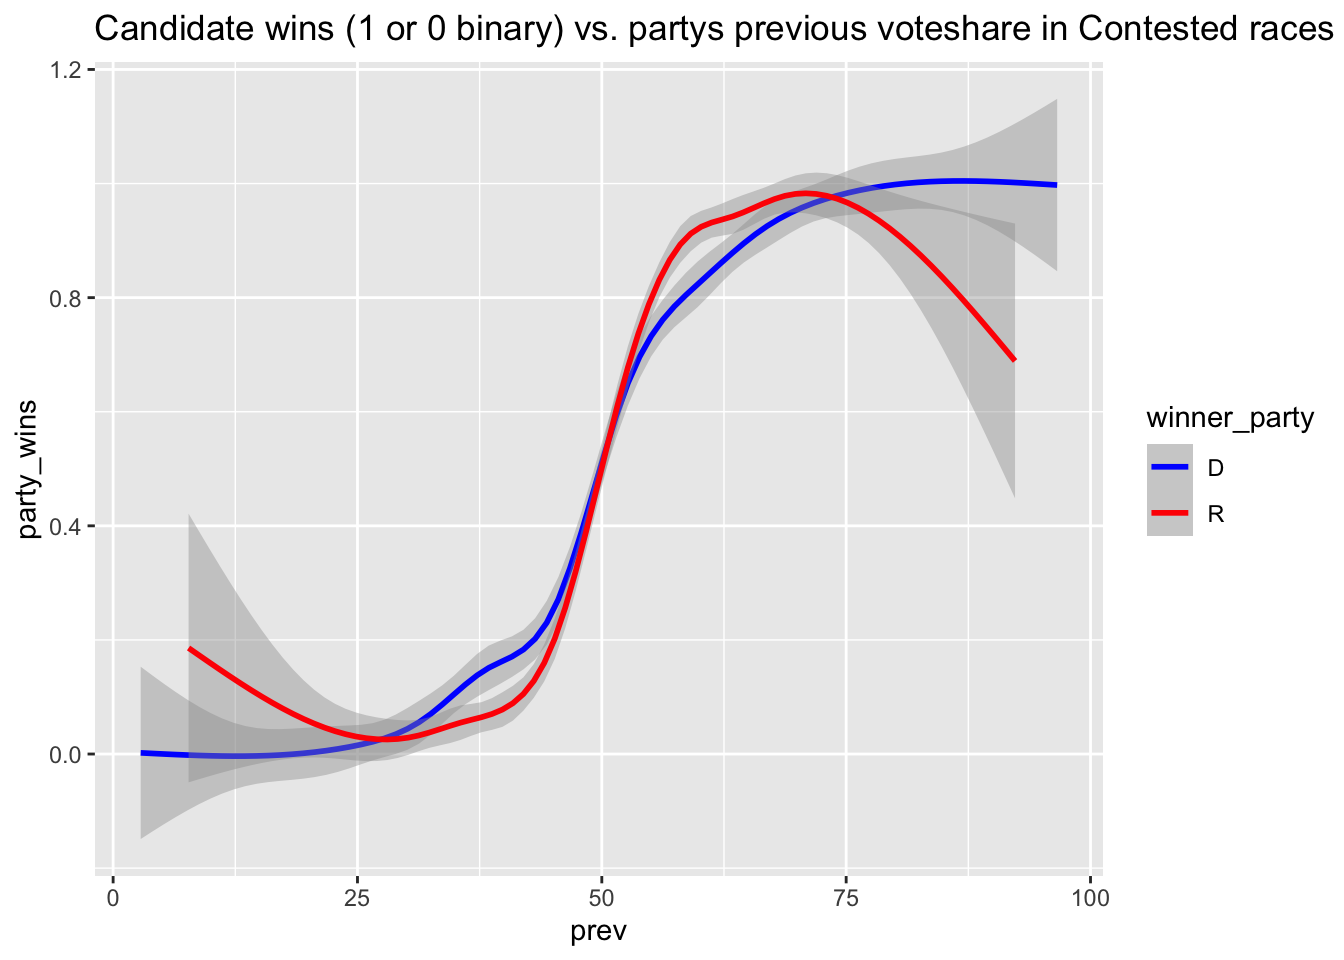
Here, I plot the probability that a candidate will win given their previous voteshare. As evident, there is a strong positive relationship, but the trend is not entirely linear.