on
Polling
Intro
In this blog post, I choose to explore both Extension #1 and Extension #2. For Extension #1, I will compare forecasting methods from The Economist and FiveThirtyEight, as well as giving my own two cents on the approach. In extension #2, I will look at historical generic ballot data, build my own model, and incorporate nation-wide level economic data to build a nationwide vote share model. I will not include a part for the Ohio-01 race because there has only been one poll so far.
Extension 1: Comparing Midterm Forecasts: FiveThirtyEight vs The Economist
** 538 Model
In FiveThirtyEight’s methodology report about their 2022 midterm forecasts, they detail their three main models: Lite, Classic, and Deluxe. Classic, their main model, incorporates polling data, CANTOR (a system that uses inference to get comparable polling stats from districts without polls), and Fundamentals(variables like fundraising, approval ratings, incumbency status, former voting patterns). Their Lite model only uses Polls and CANTOR-based polling inference, while their Deluxe model is the Classic along with expert forecasts ratings for races.
FiveThirtyEight does not simply treat all polls as equal - they have a rigorous process for rating polls based on how their methods, past performance, and company standards. Then, FiveThirtyEight weights polls in their models based off their rating.
In terms of modeling uncertainty, the FiveThirty Eight model includes for the possibility of a ‘uniform national swing,’ or situation where all the polls were biased in one party’s direction. Similarly, their model projects turnout and includes these variances into their overall distribution. While the article didn’t go into specific detail on their simulation processes, it is important to note that their CANTOR machine simulates a grid of possible variables to model a variety of outcomes.
** Economist Model
The Economist uses many similar techniques to FiveThirtyEight, but appears to rely significantly less on local ballots and more on the generic ballot.
Their approach begins at the nationwide-level, using the generic ballot results to detect the pulse of each party’s popularity. They also incorporate presidential approval, polarisation, and partisan lean into their voting-based predictors. Finally, this first stage model includes a series of fundamentals, defined in the article as: type of election year, presidential re-election status, and unemployment.
Next, The Economist model begins incorporating district-level data, which includes voting history and candidacy characteristics. In order to model the turnout, they look at nationwide swing voters and popular vote. In the article, they are quick to mention that point estimates are very challenging at the house level because they don’t follow a normal distribution. Hence, they use a “skew-T” model to allow for the long tails. Similar to FiveThirtyEight, the Economist undergoes thousands of simulations and uses their nation-wide level data to inform their distributions for each individual house race.
** Overall Thoughts
I believe the Economist’s method is more precise because it is less reliant on local polling, which is subject to high variation and bias. I also appreciated their careful discussion of simulating errors, as I believe that it can be tricky for an audience to understand the confidence interval around the point estimate.
However, one potential problem with the Economist was that it was unclear from the article if they had as precise a method for ranking pollsters as FiveThirtyEight. I imagine they do, but wanted to flag it just in case.
Both publications provide nuanced methods for forecasting electoral races, particularly when the underlying data is sparse. Their trust in the generic ballot informs my next modeling section, where I incorporate generic ballot averages into a model predicting Republican popular vote share years.
Extension #2/Model Improvements
Examining variation in pollster quality
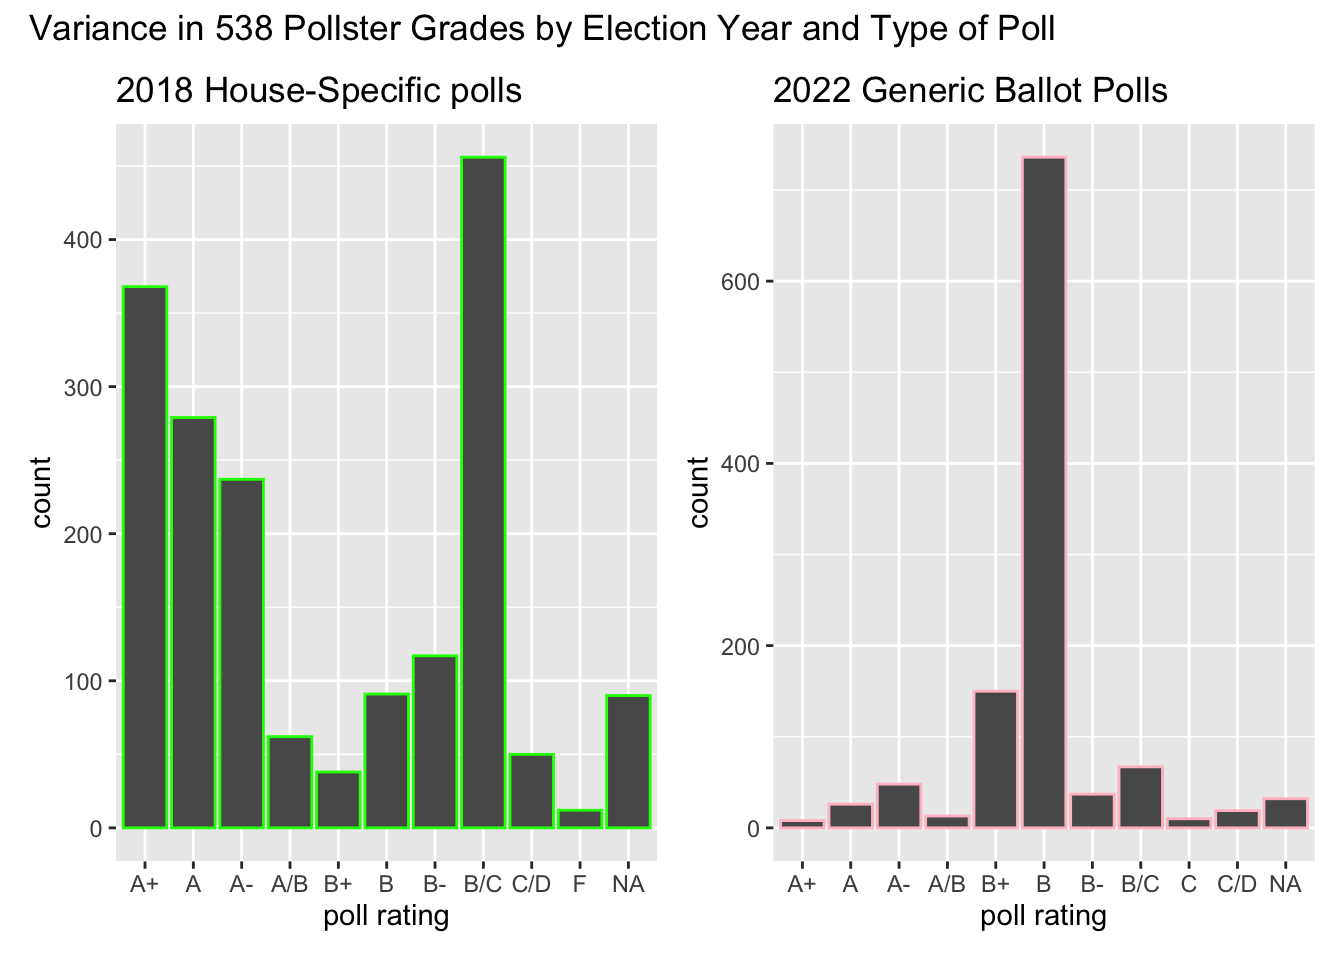
As these graphs show, 538 has higher ratings, on average, for their 2018 district-level polls than their generic polls in 2022. In both graphs, there is significant variation in poll ratings, ranging from about A+ to C/D or F.
Next, I do some preliminary model building to see how well generic ballots performed using historical data dating back to 1946.
| Model 1 | Model with Econ | |
|---|---|---|
| (Intercept) | 35.60 *** | 35.03 *** |
| (0.53) | (0.53) | |
| MidtermYear | 3.72 *** | 3.98 *** |
| (0.14) | (0.15) | |
| president_partyR | 1.72 *** | 2.01 *** |
| (0.15) | (0.16) | |
| log(days_until_election) | -0.02 | -0.03 |
| (0.04) | (0.04) | |
| Rep_2 | 0.26 *** | 0.27 *** |
| (0.01) | (0.01) | |
| MidtermYear:president_partyR | -5.84 *** | -6.06 *** |
| (0.19) | (0.20) | |
| GDP_growth_pct | 0.07 *** | |
| (0.01) | ||
| N | 2137 | 2137 |
| R2 | 0.54 | 0.55 |
| *** p < 0.001; ** p < 0.01; * p < 0.05. | ||
Surprisingly, the variable for logged days until election does not appear as significant in either regression output. Instead, the model detects that the Republican share (denoted as Rep_2), year status, presidential party, and gdp growth are most important. THe R2 increases by .01 between the two models, with the GDP growth coefficient appears significant in the second model.
I have not yet weighted by the pollster rating because it was challenging to join properly, but intend to work on that in upcoming weeks. Similarly, I will think about whether or not I would like to do my model at the nationwide or state level, but wanted to work on building a national level model since the last blog used a state-by-state prediction
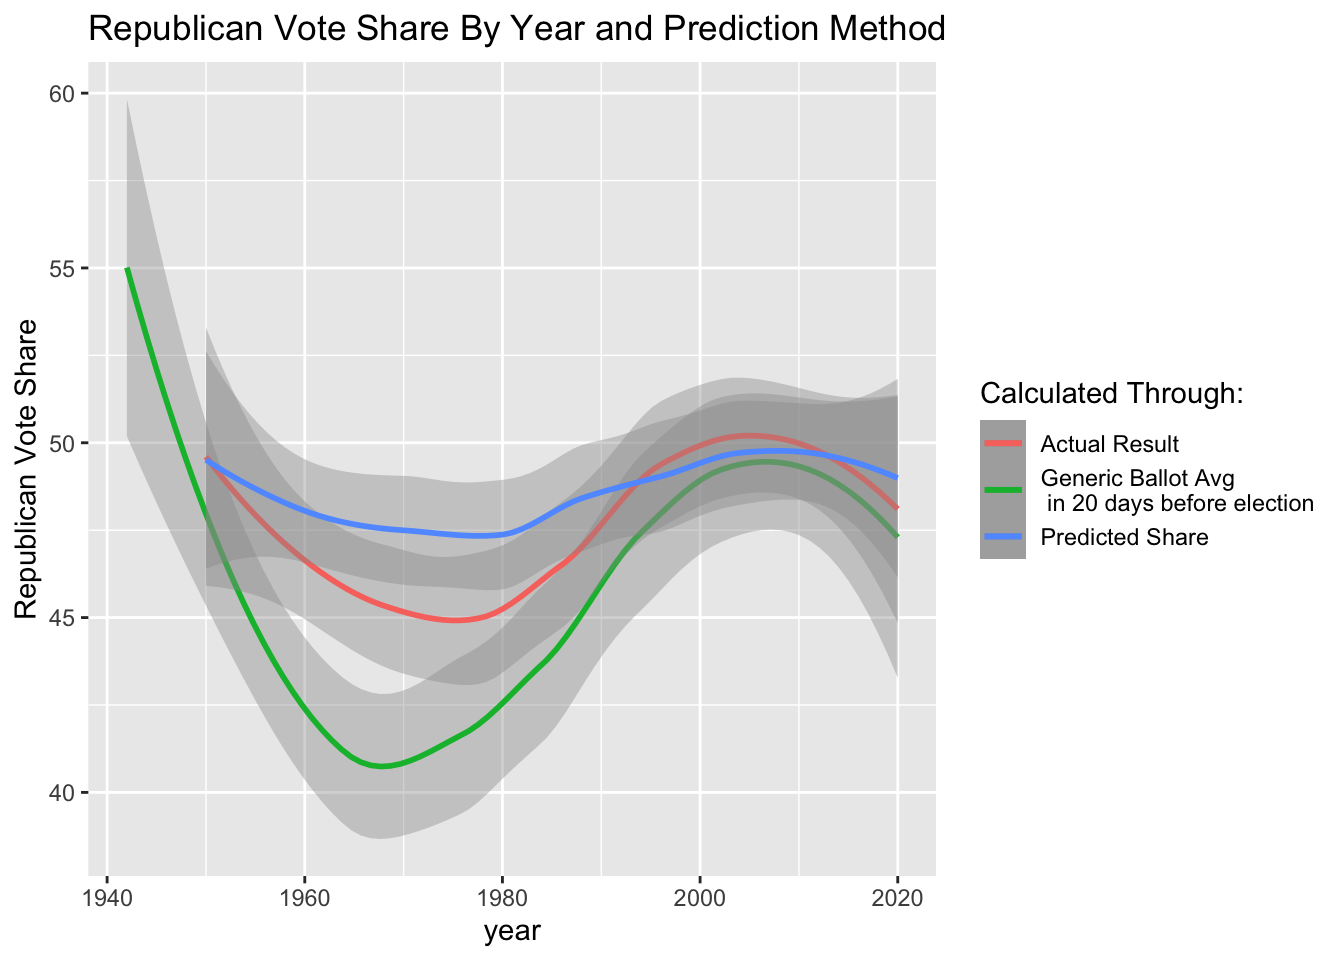
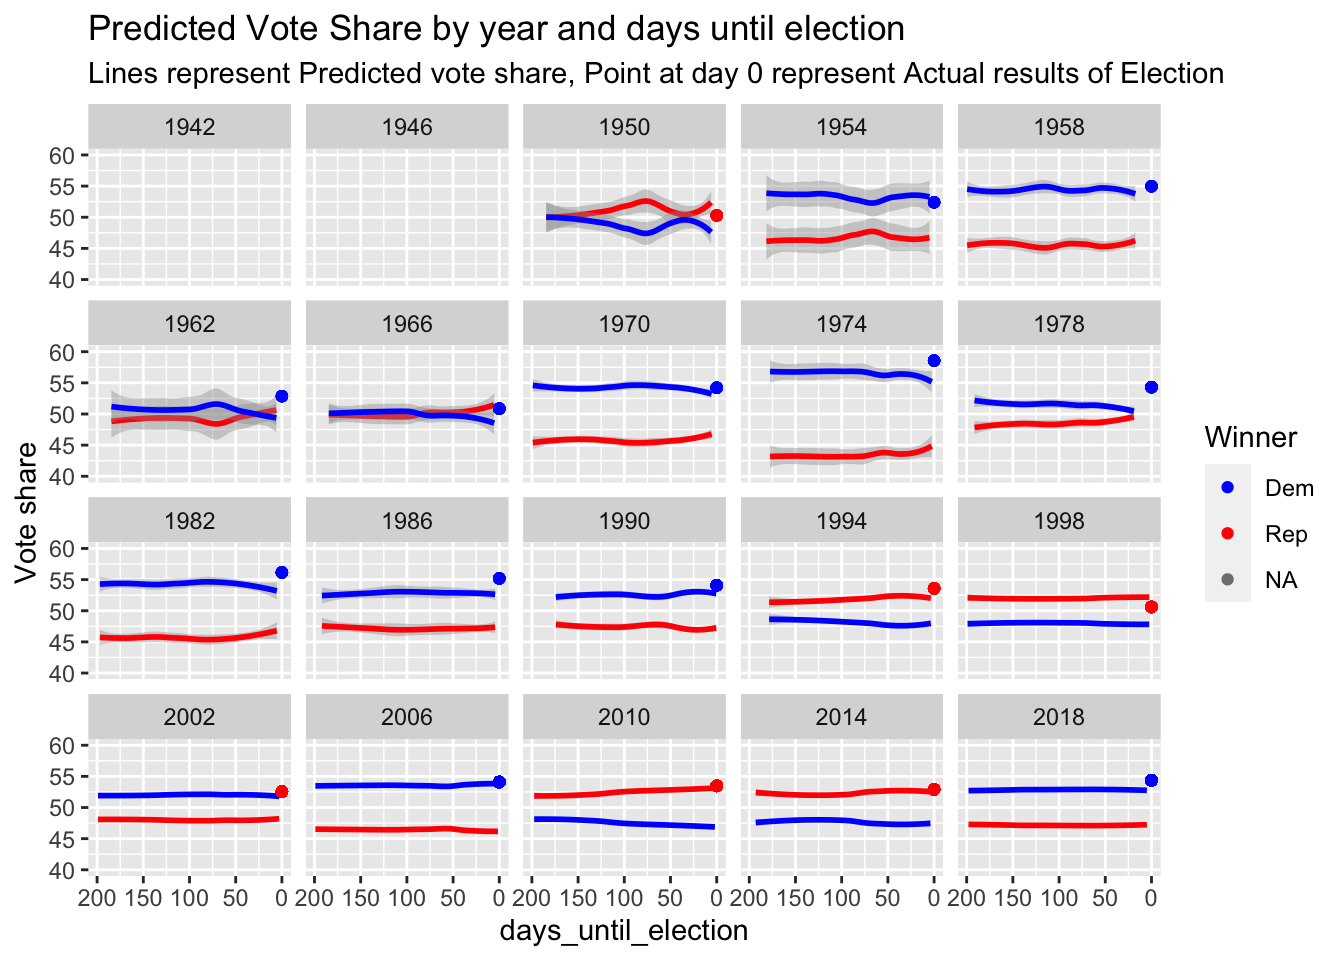
These graphs demonstrate that my prediction was, on average, closer to the actual results than simply looking at the average generic ballot, particularly in years preceding 1980. In recent years, however, the lines appear very close, suggesting that there is room for improvement in this nationwide model if I want it to be more predictive than the simple generic ballot average.
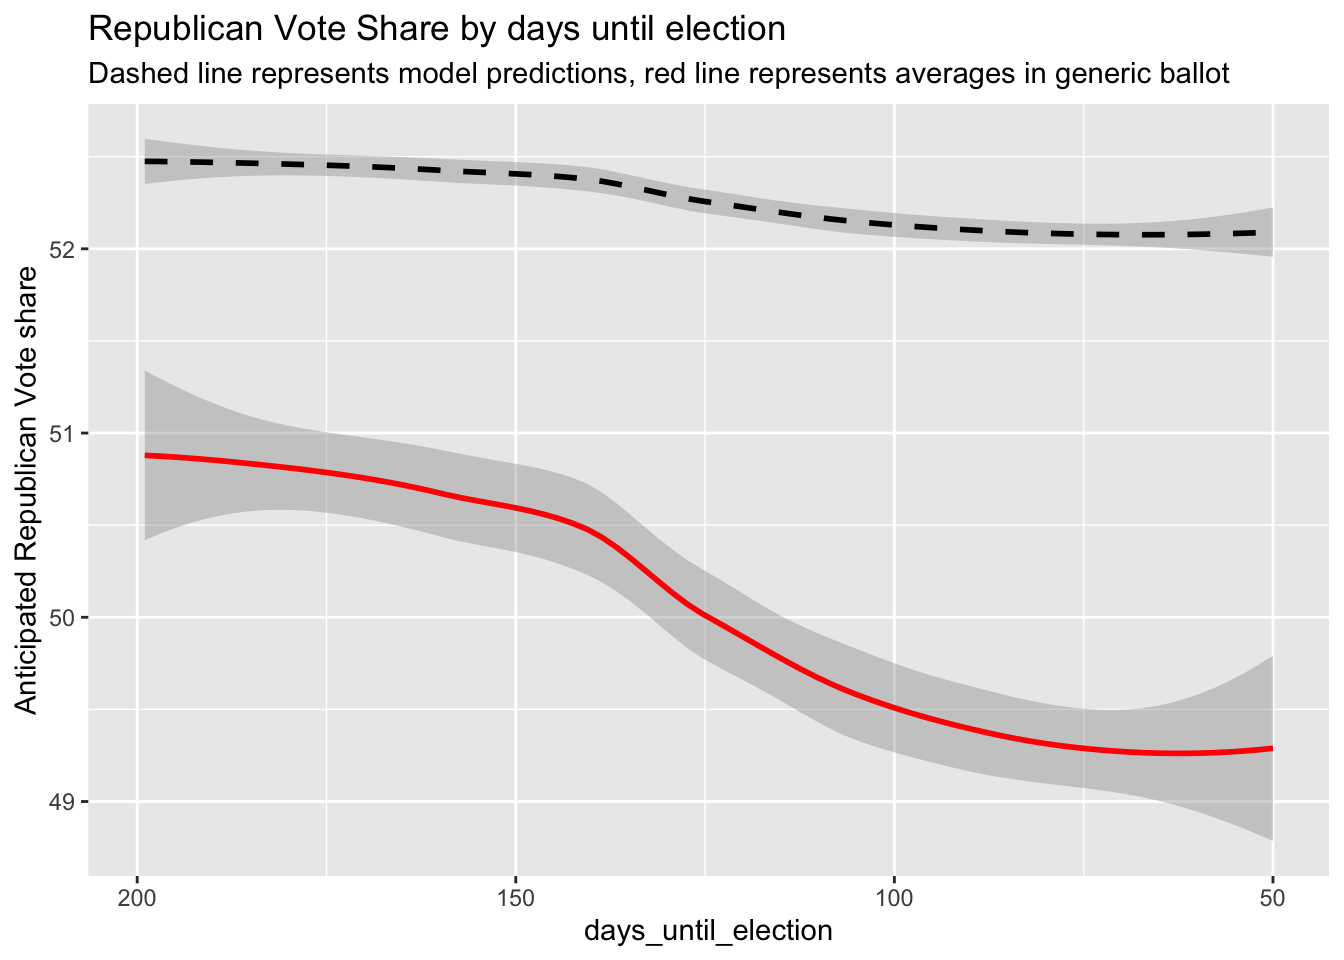
Finally, I built a predicted Republican vote share for 2022, looking at my predictions and the generic ballot averages vs. days before election.
#Conclusion
In this post, I explored the differences in Congressional modeling between two of the leading forecasting publications: FiveThirtyEight and the Economist. Additionally, I worked on building a nationwide vote share model using polling, economic, and incumbency data. In the future weeks, I look forward to finding ways to properly weight generic ballot polling and include it in my state-level model.
#Appendix
I have added a few graphs here to show more detail about the differences between my model and generic ballot averages.