on
Blog Post #2 - Economy
Intro
In this blog post (Extension #3), I am examining how unemployment rates and labor force participation rates affect voting patterns for House races in the United States at the state level. I chose to model my outcome variable as the popular vote for House races by state, as opposed to seat share, because I thought this measure captured more of the nuance behind each race. However, modeling seat share would be equally interesting and worthwhile to study.
Data
For my local dataset, I join three datasets: Economic data by by state, popular voting by house (state level), and a national dataset with presidential incumbent information. I restricted the economic data to just be in the 3rd quarter so it was the most recent for elections. To compare local to national data, I built a national dataset of nationwide employment and house voting.
Exploratory Plots
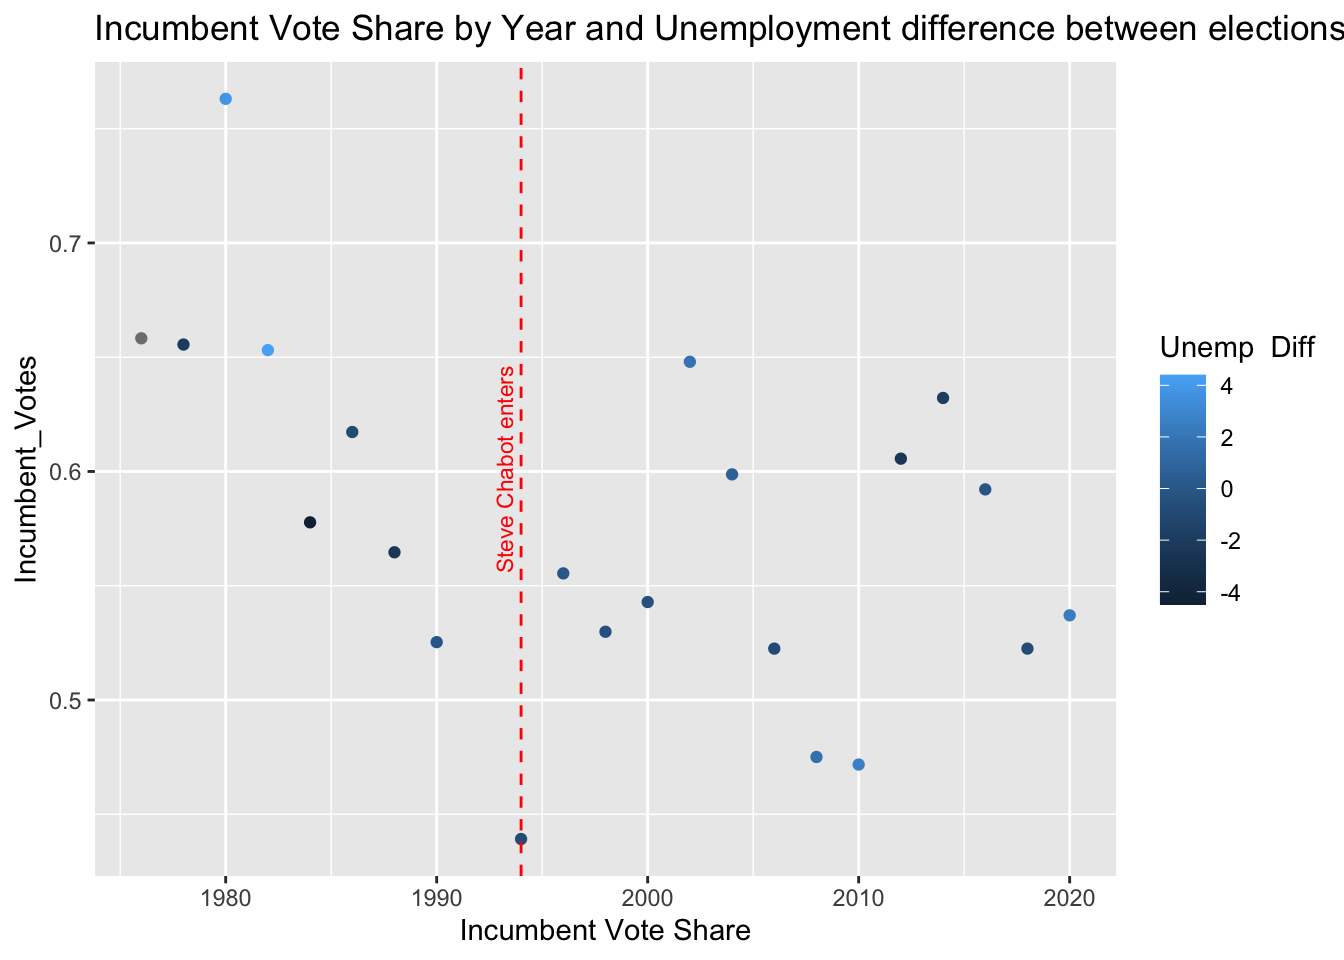
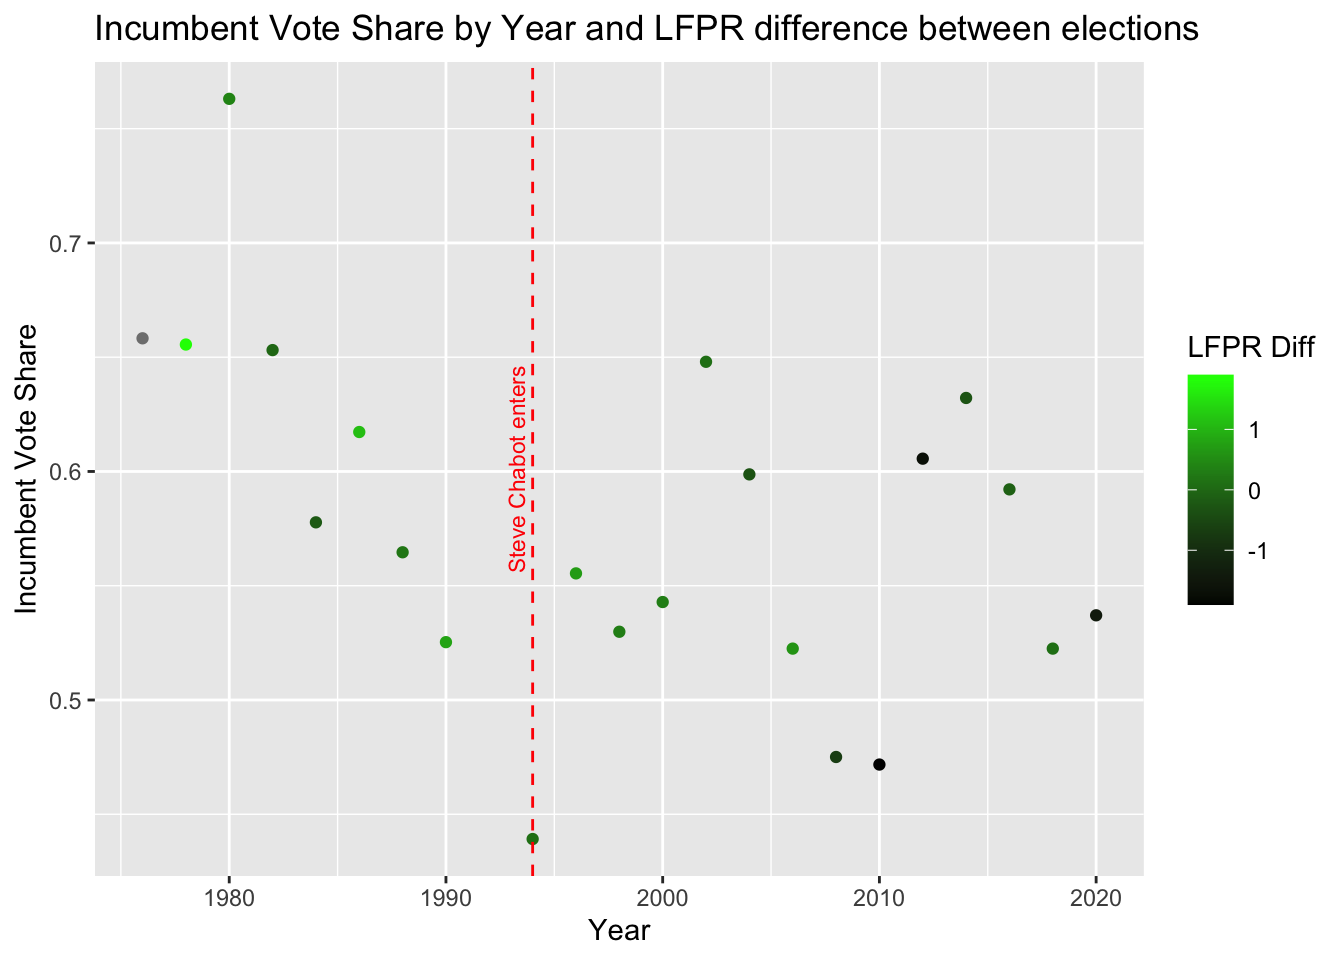
Using every state*election year from 1976-now, I look at trends for examining the state-wide Republican voteshare by differences in labor force participation rate or unemployment rates between the past and current election. I measure unemployment difference as state’s unemployment rate in current election- state’s unemployment rate in past election. Similarly, I measure LFPR difference as state’s LFPR in current election - state’s LFPR in past election.
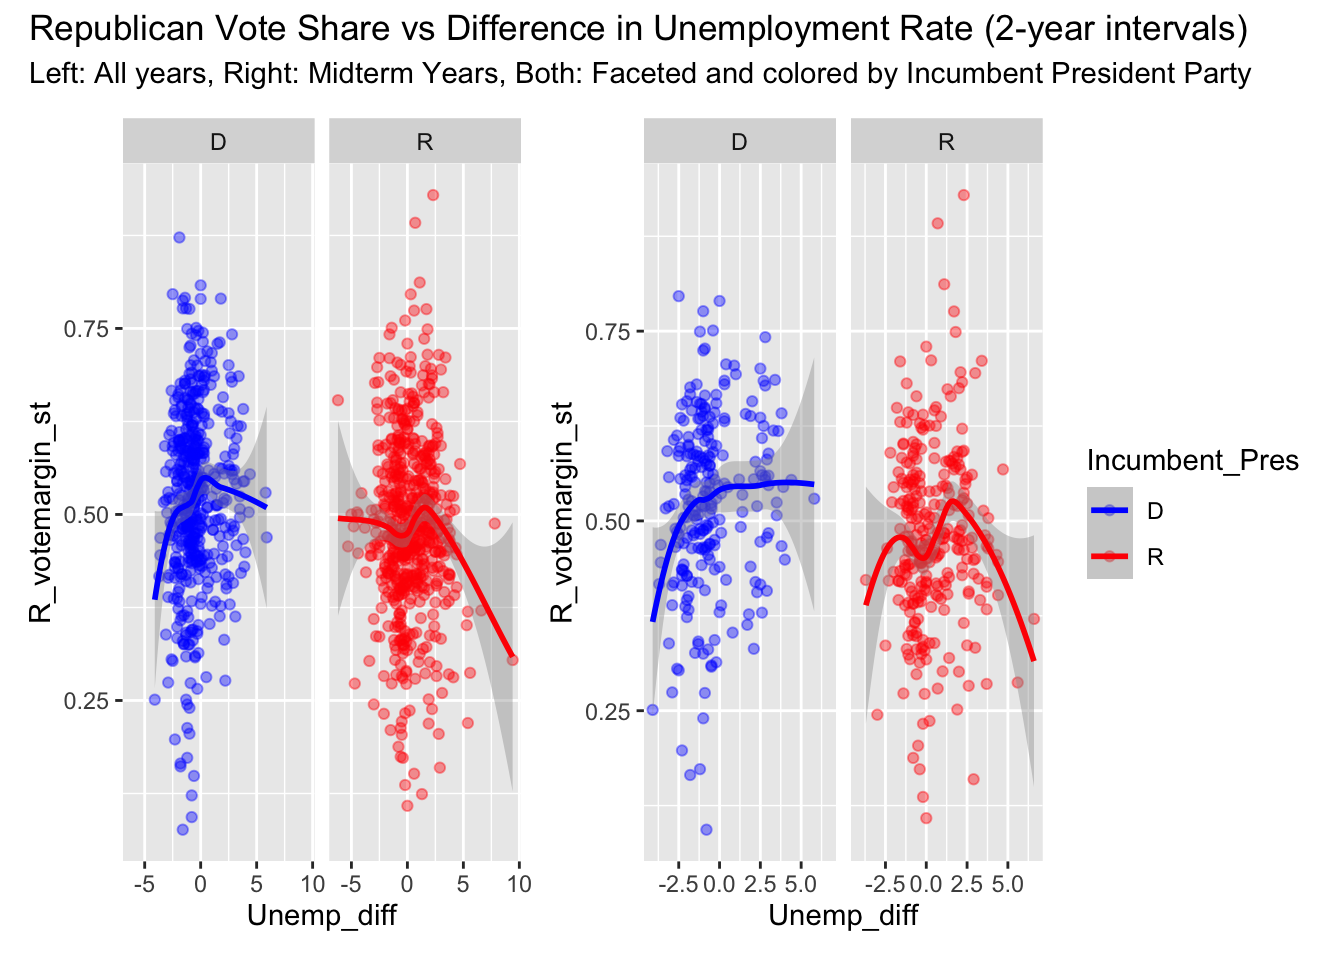
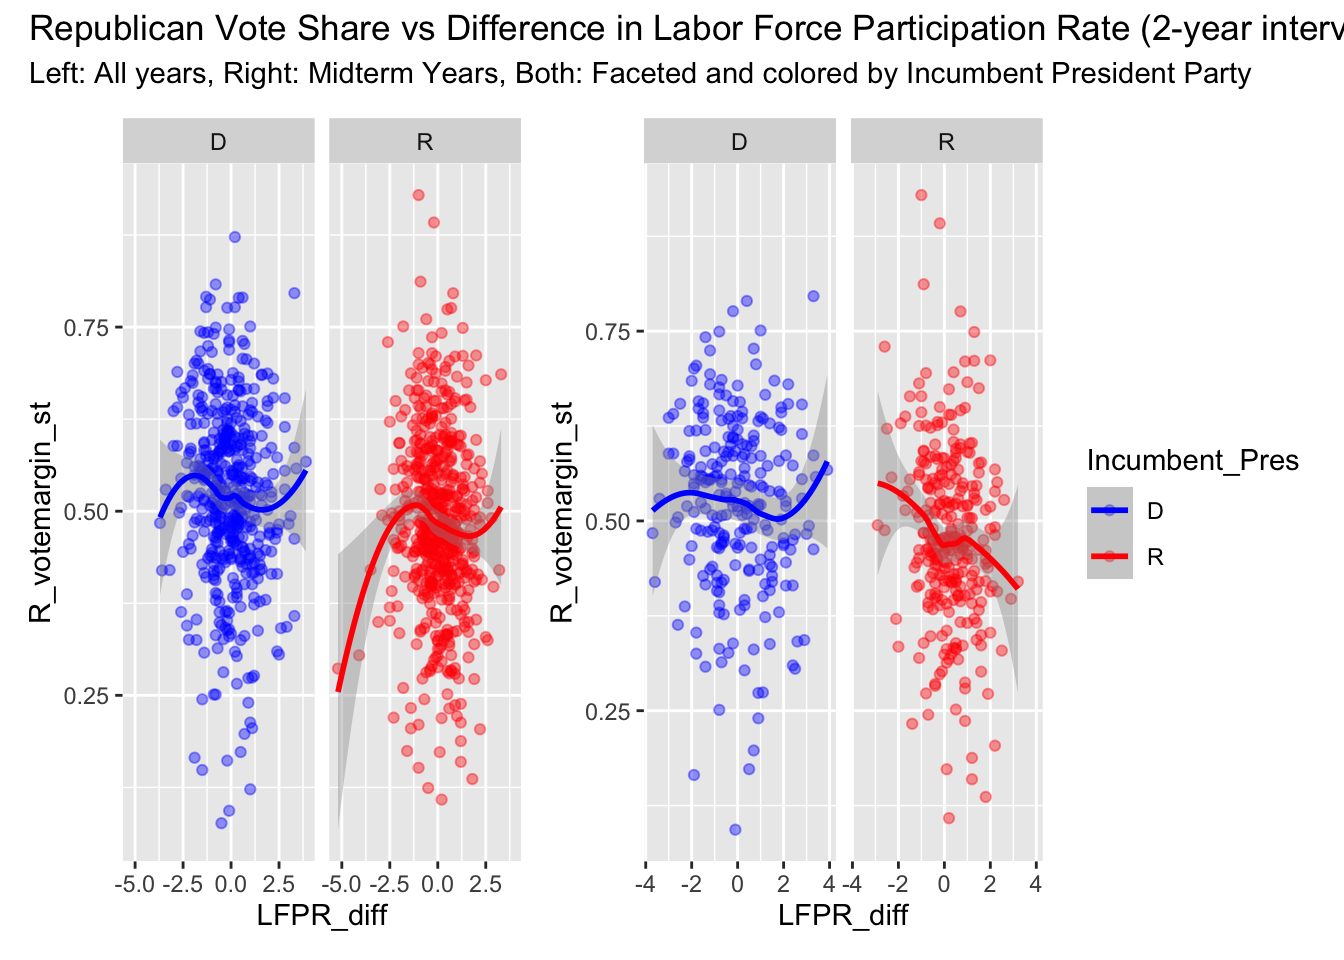 As these graphs show, there is not a obvious trend in any direction between these two
economic measures and Republican vote share by state.
For the times where the incumbent president was Republican, I expected there to be a positive relationship between labor force participation rate (LFPR) and Republican vote share along with a negative relationship between unemployment rate changes and Republican vote share. If the incumbent president was Democratic, I expected those relationships in inverse.
The lack of relationship could be due to the labor data being pooled at a state-wide level, while the races themselves represent smaller districts. Similarly, this could speak to the fact that these measures of the economy
are less tangible than indices like Real Disposable Income and CPI.
As these graphs show, there is not a obvious trend in any direction between these two
economic measures and Republican vote share by state.
For the times where the incumbent president was Republican, I expected there to be a positive relationship between labor force participation rate (LFPR) and Republican vote share along with a negative relationship between unemployment rate changes and Republican vote share. If the incumbent president was Democratic, I expected those relationships in inverse.
The lack of relationship could be due to the labor data being pooled at a state-wide level, while the races themselves represent smaller districts. Similarly, this could speak to the fact that these measures of the economy
are less tangible than indices like Real Disposable Income and CPI.
Modeling
To test these hypotheses further, I ran more rigorous models examining Republican vote share by state against a variety of variables. I split my data into two datasets: all elections before 2000 went into ‘training,’ or building the model, and and all elections 2000 or later went to testing for checking my model.
In the first regression, I use these independent variables: the state’s Republican vote share from 2 years prior along with an interaction for the party of the incumbent president with the difference in unemployment rates between the current and former election (time two years prior). In the second regression, I remove the state’s vote share from two years prior, and in the third regression I use the same model as the first but restrict the data to only midterm years.
For models 4-6, I repeat the same steps except substitute the difference in Labor Force Participation Rate for the difference in unemployment rate. In models 6-7, I use national unemployment and voting data.
| R_Vote Share | R_Vote Share | R Vote Share (Midterm) | R_Vote Share | R_Vote Share | R Vote Share (Midterm) | R Vote Share (National) | R Vote Share (National) | |
|---|---|---|---|---|---|---|---|---|
| (Intercept) | 0.13 *** | 0.51 *** | 0.16 *** | 0.13 *** | 0.51 *** | 0.14 *** | 0.38 *** | 0.49 *** |
| (0.01) | (0.01) | (0.02) | (0.01) | (0.01) | (0.02) | (0.09) | (0.01) | |
| lag_R_vote | 0.78 *** | 0.76 *** | 0.78 *** | 0.77 *** | 0.22 | |||
| (0.03) | (0.04) | (0.03) | (0.04) | (0.20) | ||||
| Unemp_diff | 0.00 | 0.01 | 0.01 | 0.01 | 0.00 | |||
| (0.00) | (0.00) | (0.01) | (0.04) | (0.04) | ||||
| factor(Incumbent_Pres)R | -0.03 *** | -0.04 *** | -0.07 *** | -0.03 *** | -0.04 *** | -0.05 *** | -0.03 * | -0.03 * |
| (0.01) | (0.01) | (0.01) | (0.01) | (0.01) | (0.01) | (0.01) | (0.01) | |
| Unemp_diff:factor(Incumbent_Pres)R | -0.01 * | -0.01 | -0.01 | -0.02 | -0.01 | |||
| (0.00) | (0.01) | (0.01) | (0.04) | (0.04) | ||||
| LFPR_diff | 0.00 | -0.00 | 0.01 | |||||
| (0.00) | (0.01) | (0.00) | ||||||
| LFPR_diff:factor(Incumbent_Pres)R | -0.01 | -0.00 | -0.01 | |||||
| (0.01) | (0.01) | (0.01) | ||||||
| N | 545 | 545 | 296 | 545 | 545 | 296 | 25 | 25 |
| R2 | 0.63 | 0.03 | 0.61 | 0.62 | 0.03 | 0.61 | 0.35 | 0.31 |
| *** p < 0.001; ** p < 0.01; * p < 0.05. | ||||||||
From the first three columns, we see that the model with the highest R-squared, or deviance explained, is the first column, which includes all years and information about the state’s vote in the election prior.
The lag_R_vote should be interpreted as: every .01 point increase in the state’s prior Republican vote is associated with a .0078 increase in the following election’s Republican vote. I refer to these by hundredths because the voting share is measured in hundredths. This technique can be referred to as serial correlation, where I am using the lagged variable of interest as an independent variable.
In all of the models, the coefficient for incumbent president is significant, ranging from about -.03 to -.07. This suggests that a party’s house vote is expected to decrease if it is the same party as the incumbent, even holding constant state’s voting patterns. It is interesting how the coefficients are larger in absolute value in columns 3 and 6 because this may confirm prior studies showing that midterm years are particularly bad for parties of the incumbent president.
Interestingly, the unemployment RATE difference term is not significant at the 5% level for incumbent Democrats (our base group), but has a very minor significant coefficient in the context of Republican incumbent Presidents.
Similarly, in my columns 4-6 where I repeat the same steps using LFPR as the economic independent variable, the coefficients on the difference in LFPR between election years do not report significance at the 5% level and the Republican vote share seems primarily dependent on the state’s most recent voting patterns and the party of the Incumbent President.
The R-sq is significantly stronger with state-level data than nation-level data, however these models are challenging to compare because there are vast differences in sample sizes.
Model Validation
Next, I wanted to check how well my model had done, so I compared results between my predictions and the actual Republican vote shares in all years before 2022 (since we don’t have actual results for that yet). To save time, I only tested my first model, although testing the other would also prove fruitful.
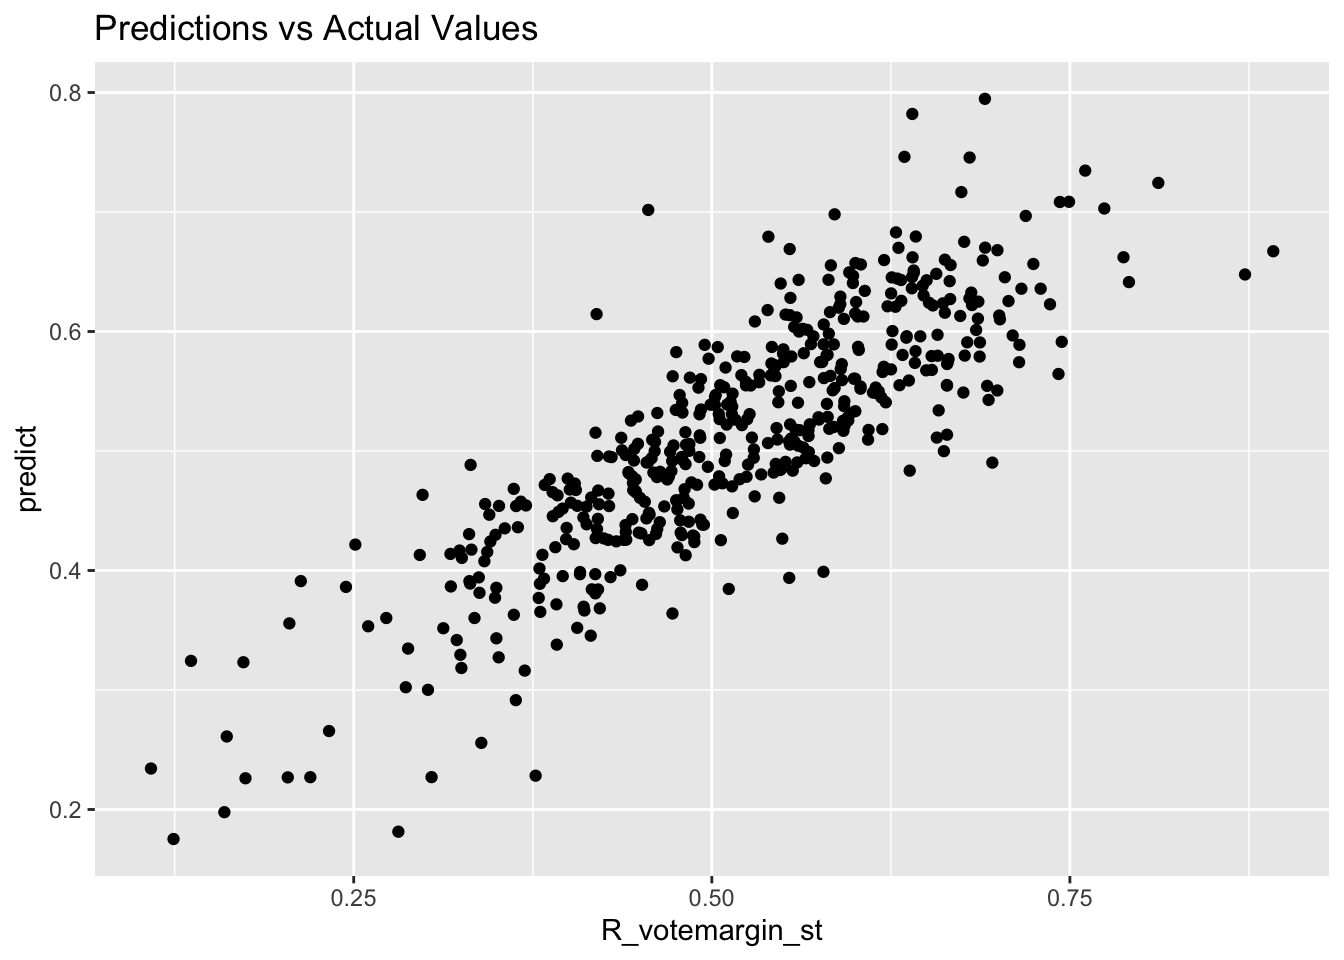
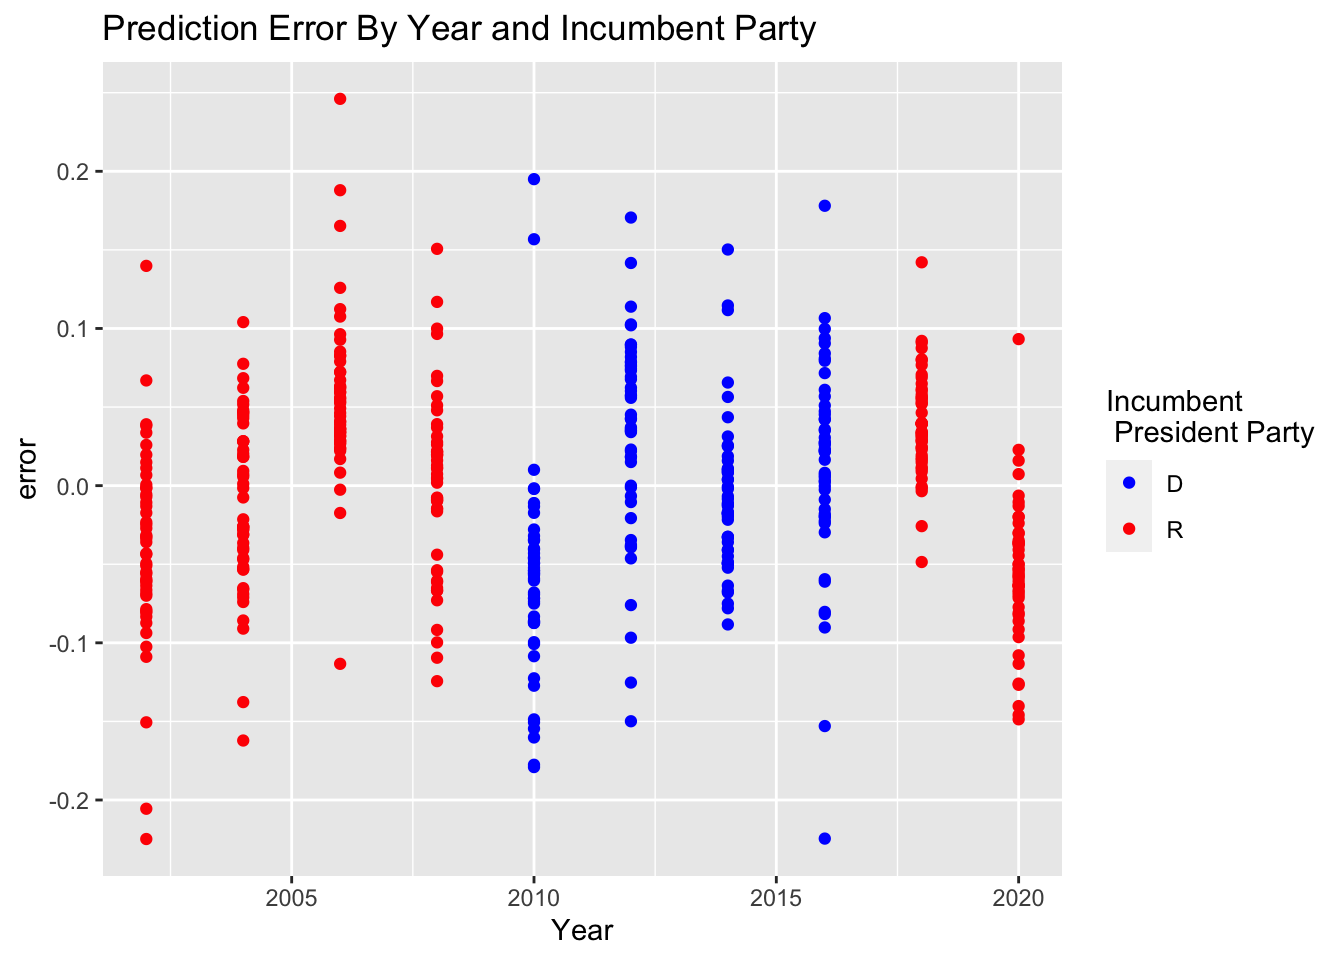
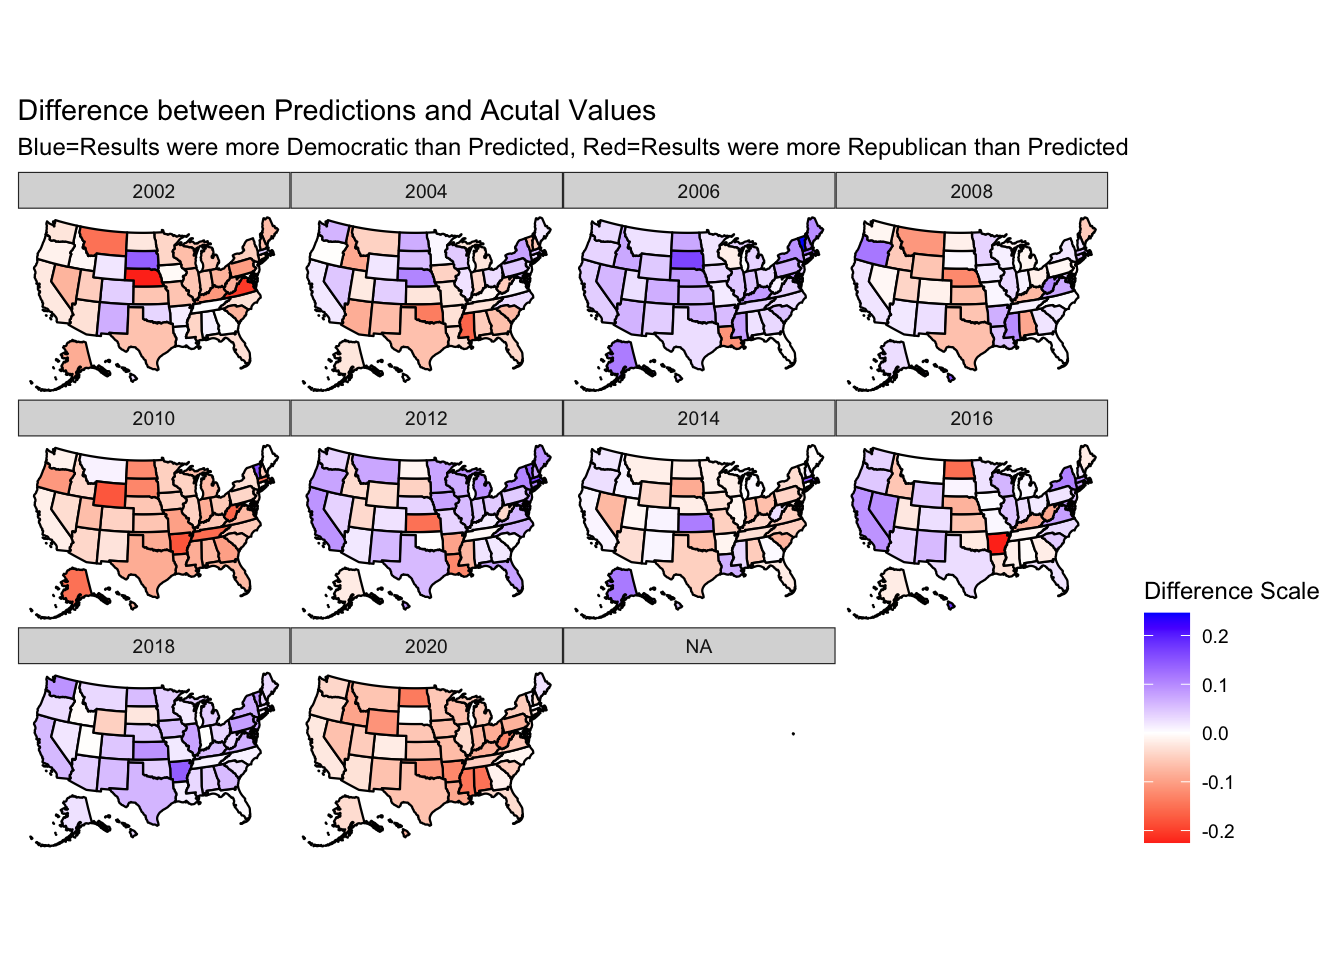
## [1] 0.005078461 0.013207290 0.005334608 0.005145969 0.013270221 0.005325042These plots above show the distributions of errors across party, year, and state. Fortunately, there does not appear to be a significant bias in my model’s errors. However, to fully analyze the modeltake much more time and research to fully ana
Additionally, at the very bottom, I printed out the MSE for each local model. This shows that including the lagged Republican vote share significantly reduces error, however it may be susceptible to overfitting in the long term.
Ohio-01 Race
Finally, I looked at my congressional race- Ohio 01. Since this dataset is very small, I was unable to find any meaningful patterns but it provided a little more background into the economic landscape and voting patterns in the district.
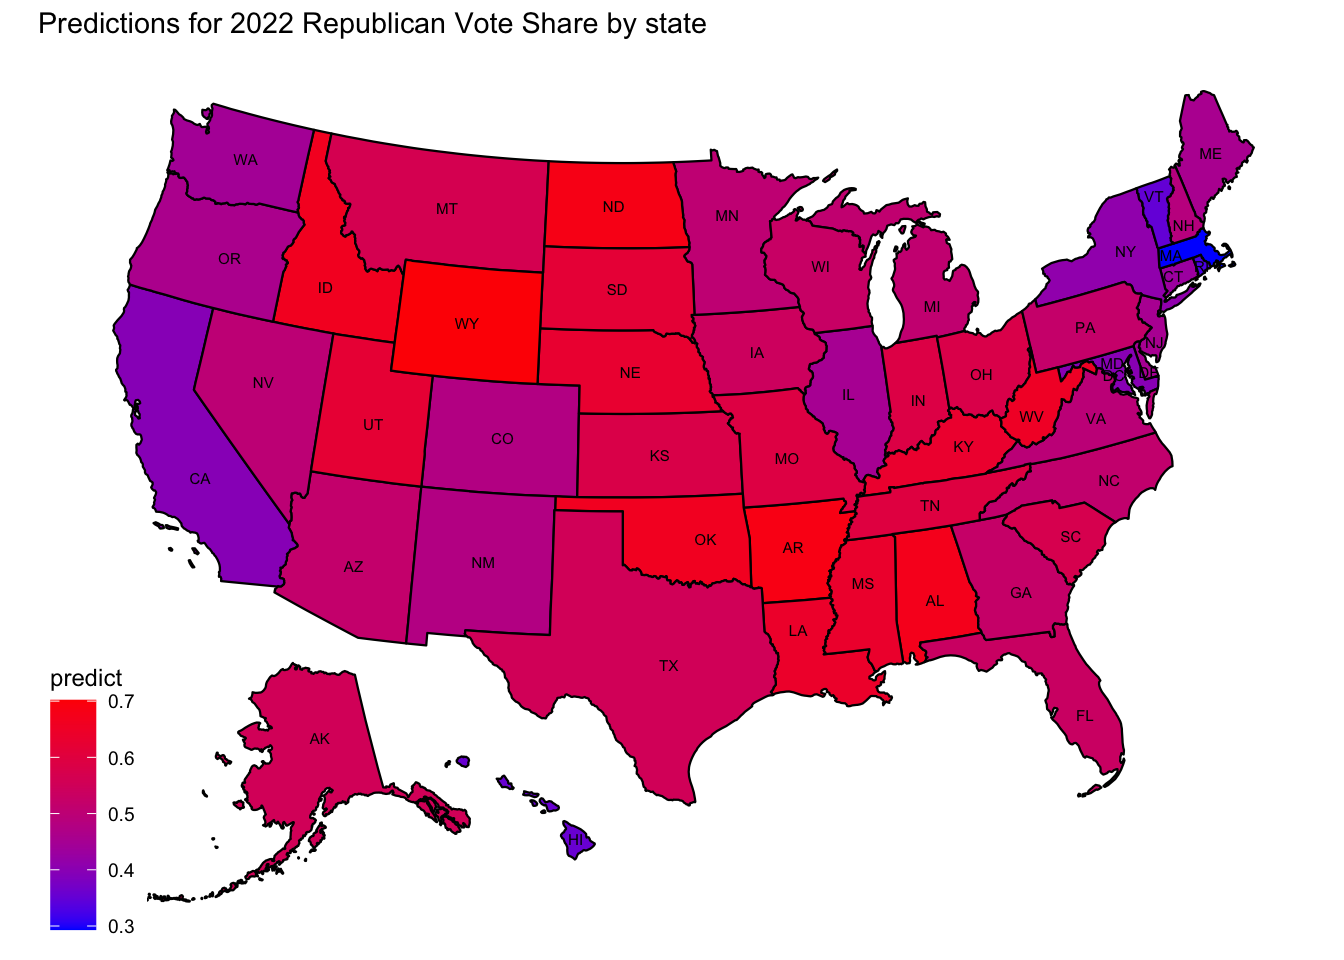
2022 Predictions
To end my blog, I plotted my predictions for house vote share by state in 2022, using model #1.
Since I didn’t yet have Q3 economic data, I used the latest month - May.
Conclusion
In this blog post, I explored the relationships between unemployment rate/ labor force participation rate and voting at the state level, and found very little significance of a clear correlation. Hence, this project would require further delving into to see whether more nuanced models would detect a clear relationship or if the employment part of the economy is not what voters focus on.
My regressions did however show that voting is very serially correlated - states have a strong correlation from year to year. Additionally, the incumbent president plays a negative role, on average, particularly during midterm years.
Looking forward to 2022, this project is very relevant. Biden’s economy has been known for strong job growth but also overwhelming inflation. So, the economic measures we use to model outcomes are not necessarily substitutable and may have grand implications for house popular vote/seat share.